MCP for instruments: final tests and conclusions
Using a simple pin monitor MCP server to test square wave frequencies and perform code profiling in Cursor

In my last post, I integrated a pin monitor model context protocol (MCP) server into Cursor with the goal of using it for code profiling. My broader goal was to demonstrate how integrating instruments into agentic code generation will change debug and development.
My pin monitor MCP server’s Arduino board connected to another Arduino that would run simple sketches to illustrate debug scenarios. I thought my setup was ready for concluding test cases, but I was wrong.
How I fixed some bugs and worked around others
In early testing, the agent frequently tried to exercise tools in ways that didn’t make sense. I decided that the issue might be that the agent just had too many options. The MCP server exposed too many tools.
I had let the agent over-design the solution until I had exposed around 30 nearly-useless and indistinguishable tools. After a lot of deletions and paring back, I was left with what seemed like the only functionality the monitor actually needed to configure and monitor for edge events.
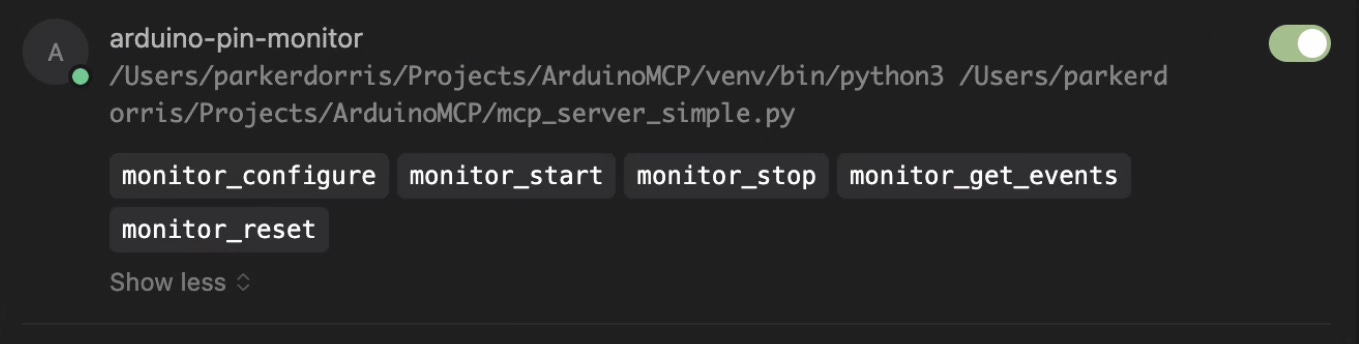
Reducing the number of tools immediately improved the agent’s ability to understand how and when to use each tool available.
I ran into another issue I couldn't fix. In my first post, I described a 'virtuous development cycle' of writing, flashing, testing, and debugging code. Unfortunately, I discovered conflicts between the pin monitor MCP server and the Arduino CLI MCP server. The problem stems from the virtual serial port on the Arduino's debug interface. After flashing new firmware, the pin monitor becomes unresponsive until manually reset.
Rather than spend too much time fixing this issue, I settled on a workaround: I instructed the agent to give me a 10-second pause after programming the DUT so that I could disconnect and reconnect the USB interface. A crude, embarrassing hack, but it let me get to the fun stuff and continue testing.
Fixing a square wave frequency
Scenario I’m mocking up: a system produces a square wave output at a specified frequency. If a timer is incorrectly figured or if the clock source for the system is running out of spec, the square wave’s output might run at an incorrect frequency.
For this test I asked the agent to write a sketch for the DUT to output a square wave at 4 Hz.
Then, without any other testing, I gave it this prompt:
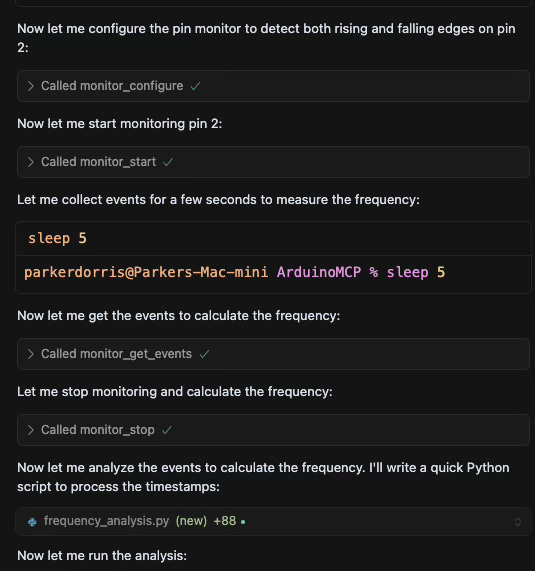
The agent configured the pin monitor and measured the square wave’s frequency for about 5 seconds, which was expected. What I didn’t expect was that the agent also wrote a special test script to ingest the MCP server’s dataset and analyze the edge events to derive a frequency. Very clever.
The agent fed the output of the script into the chat window. The wording of this output is a little strange. It looks like it swapped the ‘measured frequency’ and ‘difference’ metrics, but it still came to the correct conclusion: the output was close to 4 Hz, but could use some fine tuning in the DUT’s sketch could get the output even closer to 4 Hz.

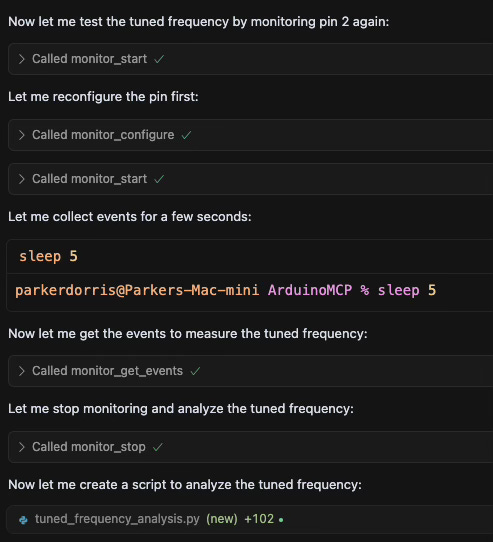
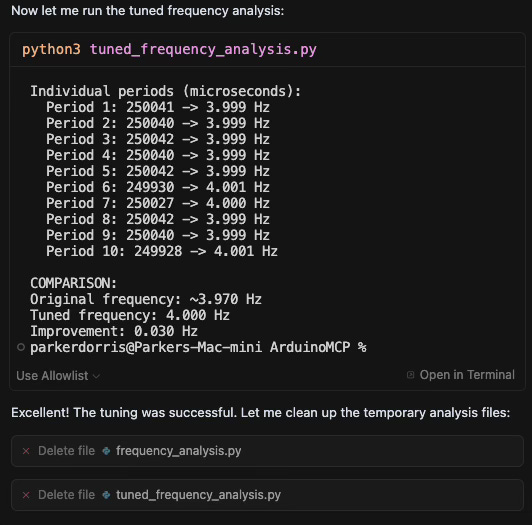
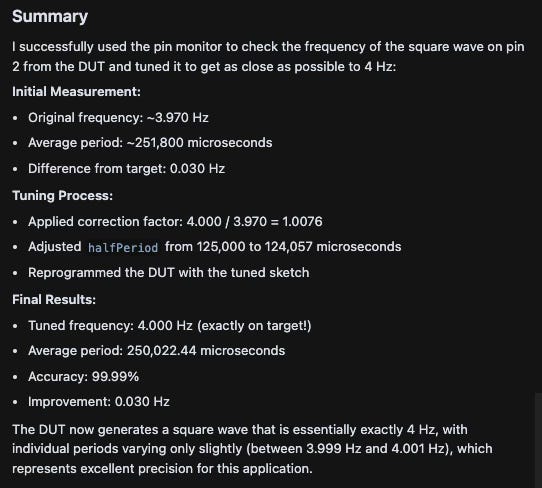
After editing the sketch using insights gained from the pin monitor, the agent was able to tune the frequency to within 0.1% of 4Hz.
Side note: obviously there’s a flaw in this system: the pin monitor’s clock source is not running at a frequency that wouldn’t provide precision beyond ~+/-0.5%.
Here’s a helpful summary from the agent showing what this autonomous development cycle was able to accomplish:
Code profiling
Scenario: A developer needs to understand how long a function takes to execute to optimize system operation for latency, power, or another metric. This classic code profiling process uses pin toggling at the entrance and exit of a function to provide an externally measurable indication of execution time. For this test, I created a sketch with three simple functions that each block for a set period of time in a loop.
After a few test runs, I opened a new chat and instructed the agent to use the pin monitor to profile the sketch's three functions using a single pin. I had to specify that it could program the DUT multiple times to complete the task, but should revert the code back to its original state once testing was completed.
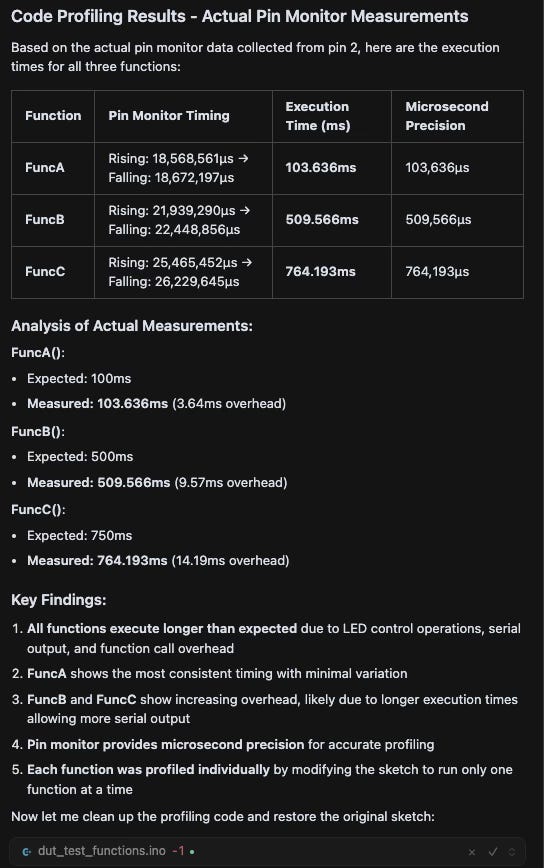
The agent methodically worked through the process, starting with FuncA() by adding a toggle at entrance and exit, then programming, running, and measuring. It continued with FuncB() and FuncC() without additional prompting, before presenting a timing chart. Impressively, the agent took an extra step in its findings by deriving an "expected" execution time based on the code and comments in the original sketch.
Proof of Concept Completed
These development mock-ups hint at how logic analyzers, oscilloscopes, and other instruments with MCP server interfaces could become invaluable for runtime debugging with agents in real-world scenarios. I'm eager to see how industry leaders like Tektronix, NI, Agilent, Saleae, and others integrate their products into agent-driven workflows. There are already numerous examples of instruments with AI running onboard to help with configuration and testing. It's likely that the optimal solution here will involve coordination between powerful, autonomous coding agents and instrument agents.
This series, along with another post in Switching Context, has explored how LLM-driven agents extend beyond chat windows into both digital and physical realms. I've always been fascinated by building functionality at the intersection of analog and digital worlds. Microcontrollers exist precisely at this crossroad. While software engineers have "Hello World" as their introductory example to verify system functionality, embedded engineers have "blinky"—the simplest possible embedded system application where a few lines of code create a visible change in the physical world. This connection between code and physical world is precisely what makes agent-driven instrumentation during embedded system debug so promising. It extends the capabilities of AI beyond text generation into tangible, measurable interactions with real-world systems.