MCP for debug instruments, part 2
Integrating a PoC pin monitor MCP server for code profiling in Cursor

In my first post in this series, I created a simple pin monitor Model Context Protocol (MCP) server. Quick reminder: MCP servers provide a standardized way for AI coding agents to access documentation and tools. My first post mentioned that the next step would be using the proof-of-concept pin monitoring MCP server for rudimentary, mocked-up debugging in Cursor. However, I decided to change course. I thought of a different use case that could be more useful, assuming I can get it to work.
I want to get Cursor to use this pin monitor MCP server for code profiling.
Code profiling: handy if you’ve got the pins and a way to monitor them
Code profiling is a broad topic so let me narrow the scope. For this proof of concept, I’m referring to a technique where the developer toggles port pin states through lines of code strategically placed in the firmware project. A toggling port pin becomes a signal. It’s a fairly low tech, barely-intrusive way of determining the runtime state of a system.
For instance, if a port pin toggles to logic high when I enter an interrupt service routine, and toggles back to logic low when I exit, I've created a signal that reveals when that routine is executing. Using an oscilloscope or logic analyzer, I can then determine how frequently the interrupt occurs, how long it takes to execute, and other information.
Remember that my goal is to insert an AI agent into the virtuous development cycle. Specifically, I want to see if I can get Cursor's AI agent to use the simple pin monitor MCP server I created in my <last post> for profiling. I'm envisioning giving Cursor straightforward prompts like:
"Profile all functions in this file and give me execution times for each"
"Tell me with what frequency this interrupt executes"
Are AI agents clever enough to receive a prompt like that and know what to do through tools to accomplish the task? Think about the logic leaps it has to make:
The agent has to understand that I’m asking for code profiling, and understand that the tool it has available to accomplish this task is the Edge detector MCP server
The agent also has to recognize that in order for the pin monitor to work, it needs to add pin toggling to the function being profiled and then program an Arduino with this modified code
Wait…Cursor has to program an Arduino board?
Yes. The first step of code profiling is identifying strategic locations within a function to add pin toggles, creating meaningful external signals you can monitor. This task should be straightforward for the agent. While I'm uncertain whether the agent understands the concept of code profiling, if it does, adding pin toggling code should be simple.
Then, it gets tricky. The agent needs to actually program the Arduino. Here’s another instance where the agent must reach into the physical world.
Potentially this sounds like a job for another MCP server, this one for Arduino board programming.
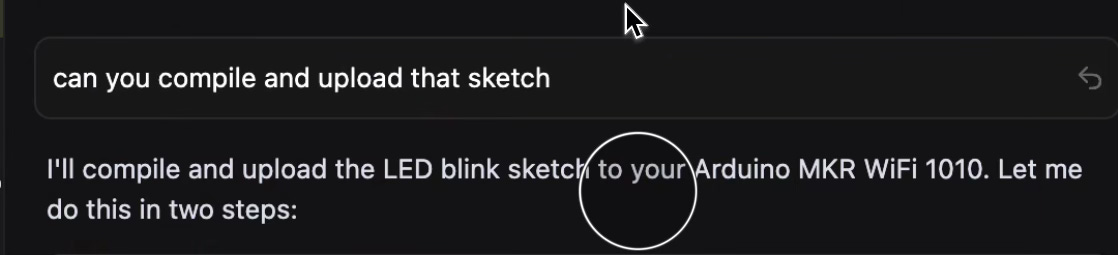
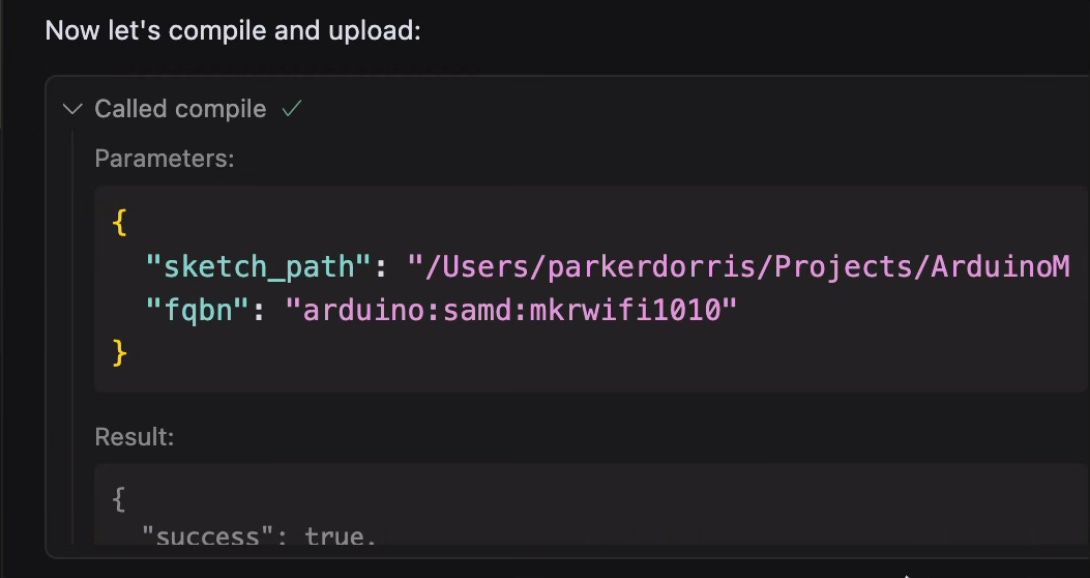
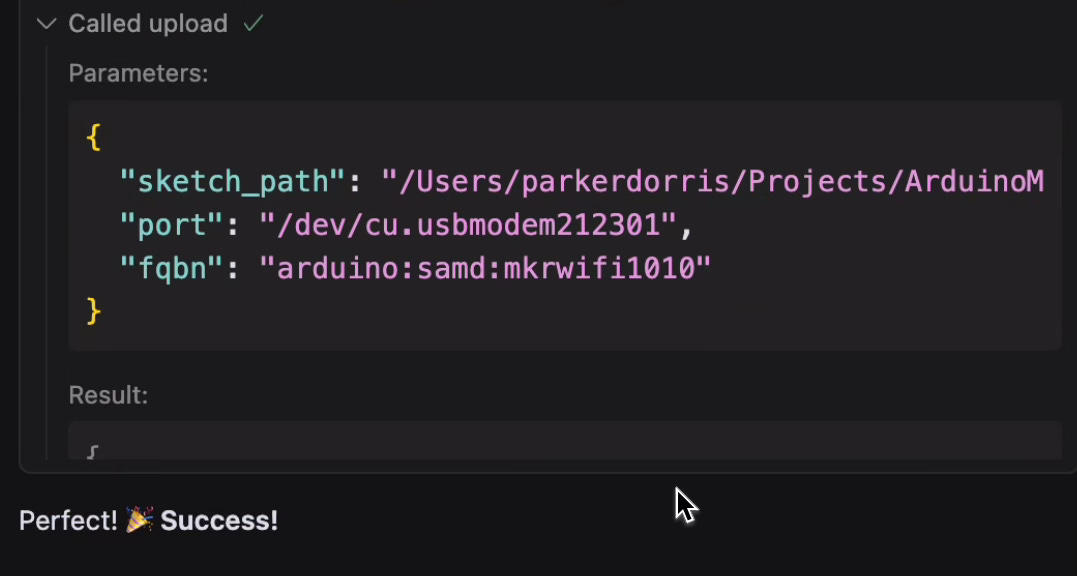
Fortunately, Arduino provides a useful starting point: a command line interface (CLI) programming tool. This tool can compile and upload sketches to Arduino boards, essentially providing the same functionality as their Cloud IDE.
Although there's no official Arduino CLI MCP server, several developers have created their own versions. I found one, cloned the repo, and that's when the struggle began.
I discovered the "MCP tools" menu in Cursor's settings, which requires a JSON-formatted description of the tool. I had no idea how to format this information correctly, but ChatGPT did. After a few iterations with ChatGPT, I successfully got the MCP server up and running.
After the agent began to understand how to make use of the the Arduino CLI MCP server’s exposed tools, it was able to compile a test sketch and run it on an Arduino with my natural language prompt in Cursor’s chat. Pretty cool!
Hardware setup
I want to pause here and make clear that the board I just programmed is a different Arduino board than the one I’m using to emulate a pin monitor.
Right now my setup looks as follows:
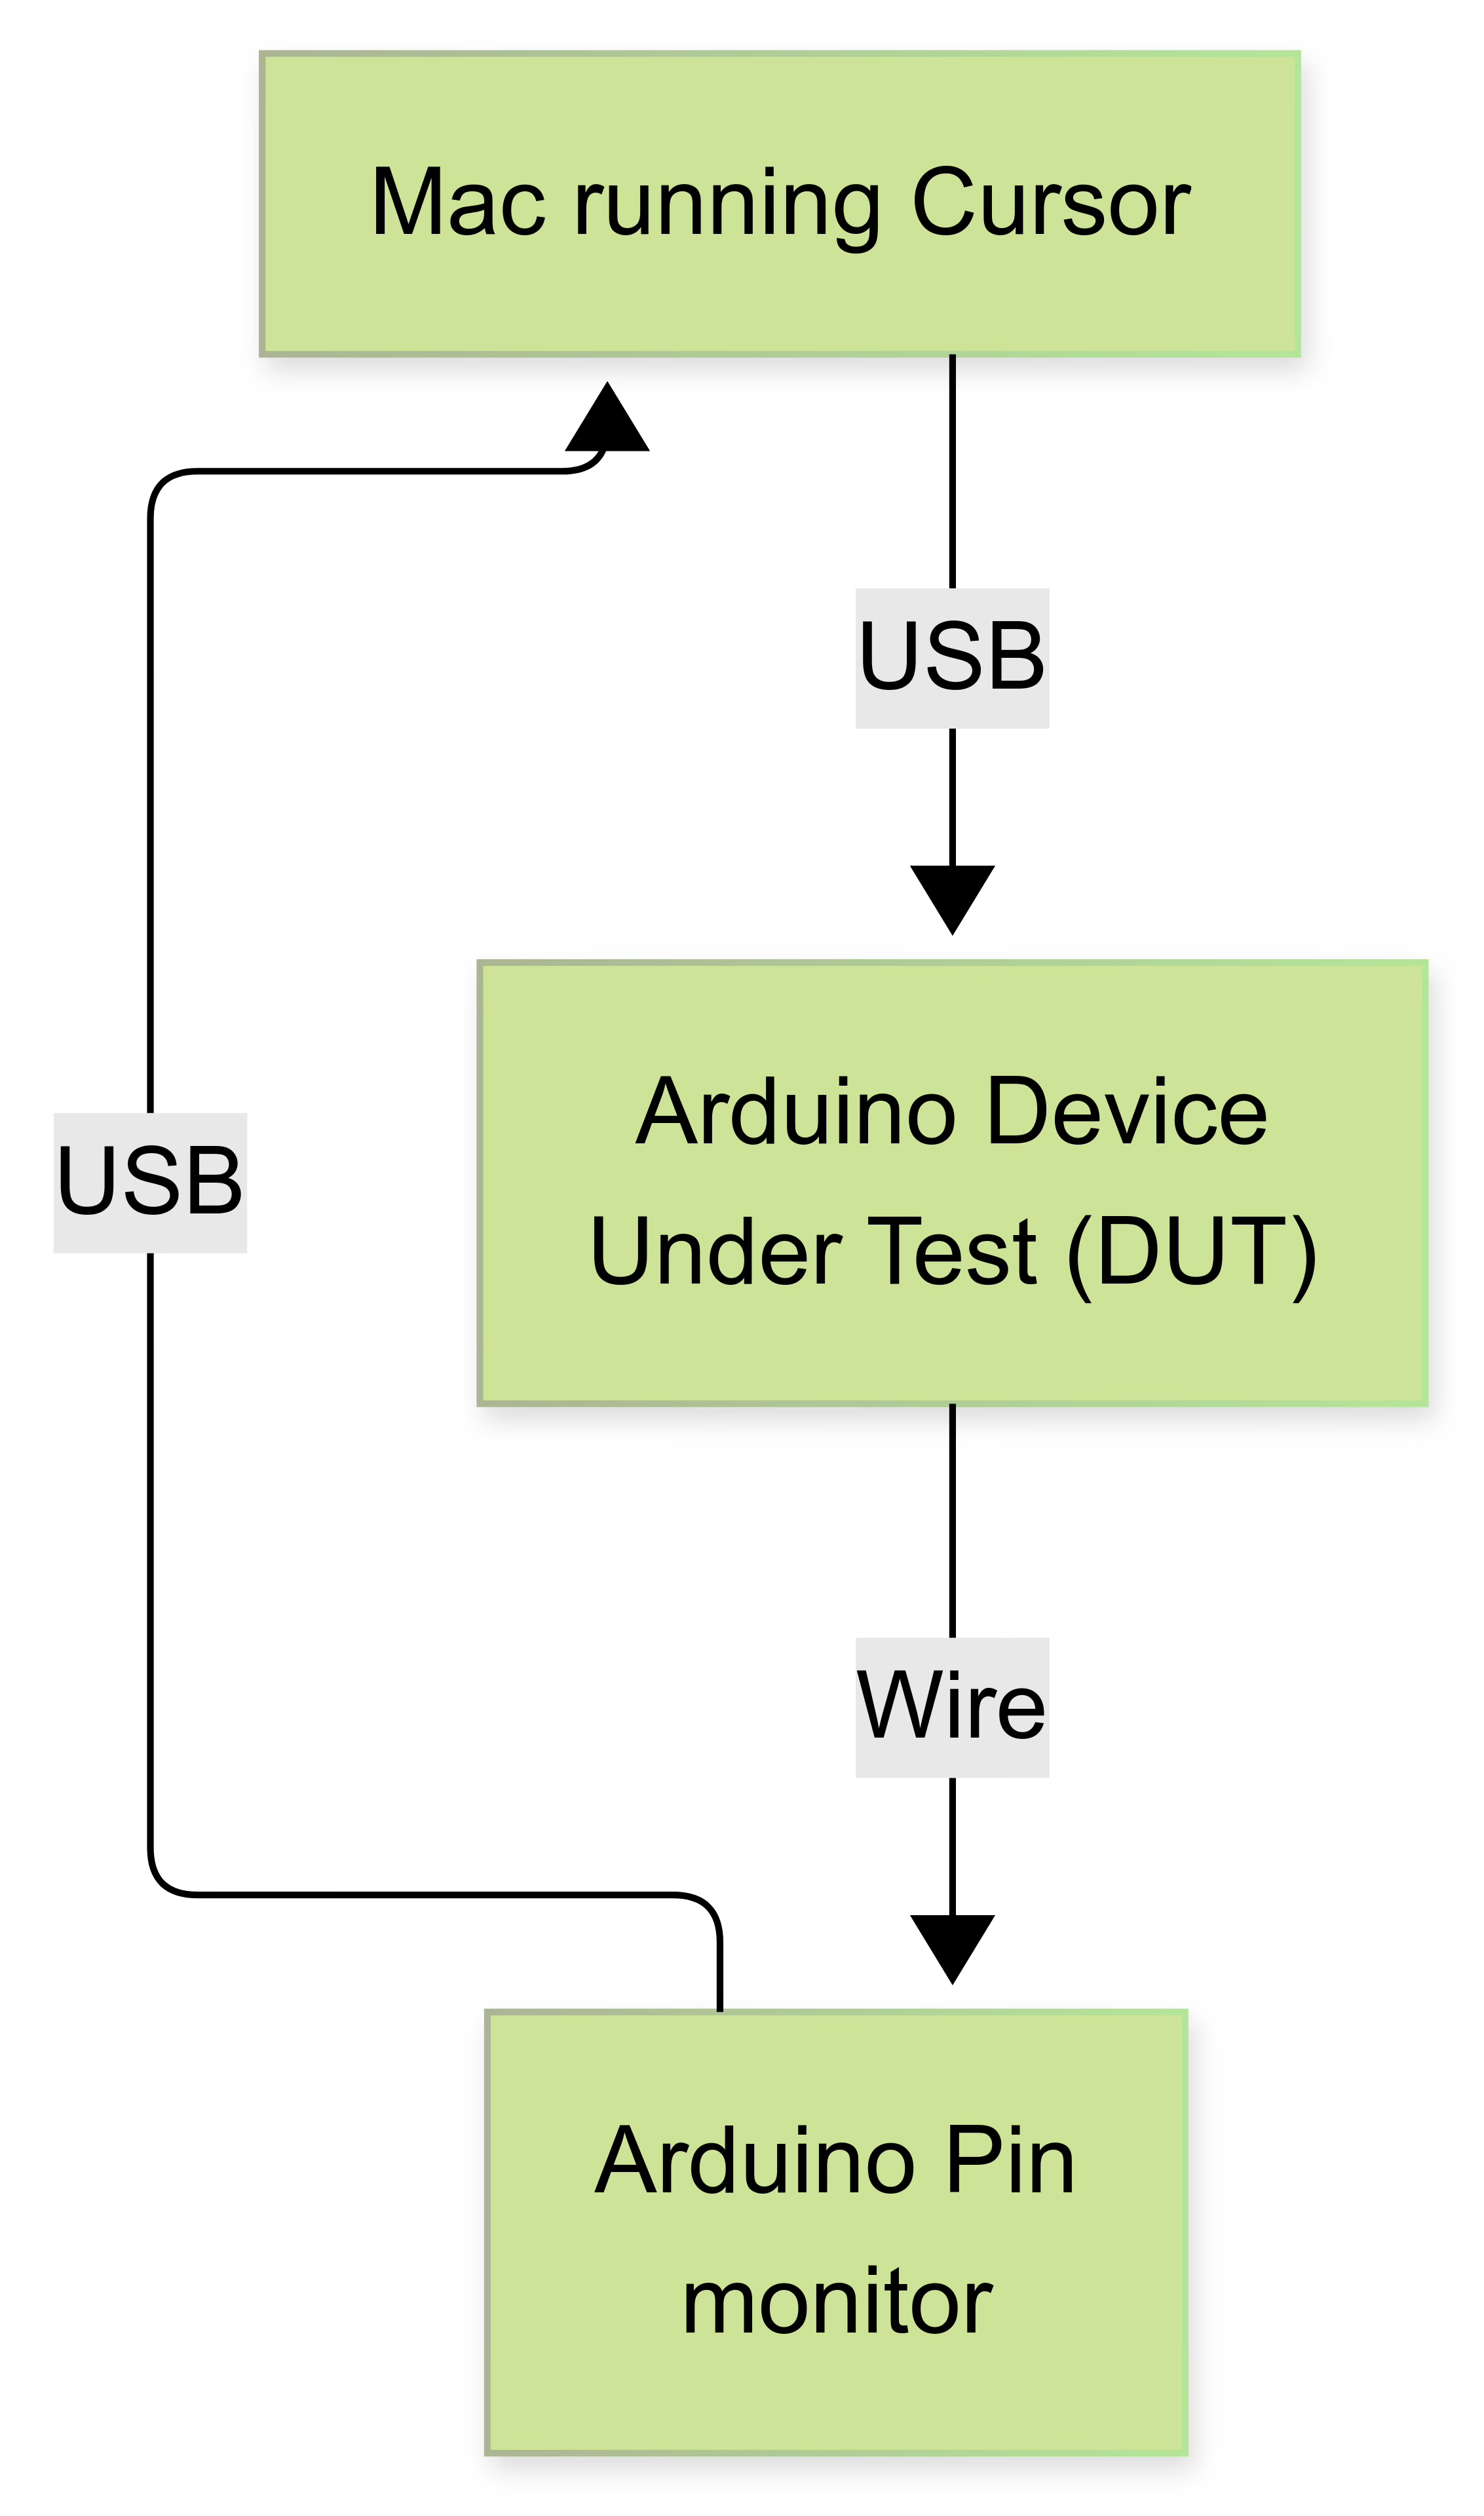
From now on I’ll refer to the Arduinos as DUT or Pin Monitor.
Modifications to my pin monitor MCP
At the end of my last blog, the pin monitor MCP server enabled a client to read a pin’s logic state and subscribe to realtime pin transition updates. Unfortunately, Cursor can have issues with monitoring a stream of data through an MCP server. After working on the PRD for this with ChatGPT, it became clear that my simple pin monitor needed more smarts so that Cursor would be able to configure the pin monitor to autonomously capture events for a period of time and report back with a log of edge events.
This required changes both to the pin monitor’s python script as well as some minor updates to the Arduino sketch. The first phases of this project were spent with AI assist building out these new features and running tests at certain milestones. Cursor cranked out code at a breakneck pace, but unfortunately its test coverage turned out to be lacking!
Integrating with Cursor
integration into Cursor’s registered list of MCP servers was challenging. First of all, Cursor’s AI agent doesn’t seem to understand nearly as much about Cursor’s menu system and MCP server configuration as you might expect. This led to issues where the upgraded pin monitor’s MCP server tools were deeply mismatched from what Cursor expected.
The most glaring issue occurred when the agent coded upgrades targeting version 1.0 of an MCP server interface library. This created a significant problem since my Cursor installation used a newer, incompatible library version. To be fair, this wasn't entirely the AI agent's fault. I should have specified the version requirements in my PRD.
Figuring out how to make the MCP server script compatible with this new version of the MCP library proved to be a surprisingly difficult challenge for the AI agent. It made a few increasingly sweaty and desperate refactoring attempts before throwing up its (virtual) hands and starting to create a ‘simple MCP server that will work’, thus discarding all our previous work.
After halting that dead end, I pointed out to the agent that the other MCP server in this system, Arduino CLI MCP server, was working properly. Perhaps the agent could use that code as a reference. After examining the source code, the agent identified the necessary patterns and finally Cursor recognized all the tools exposed by the pin monitor MCP.

But can Cursor actually do anything with my server?
Now that all the tools of the MCP server seemed to be recognized, I expected smooth sailing, but that wasn't the case. None of the newly enumerated tools functioned properly. Despite trying various commands to monitor the port pins, nothing worked.
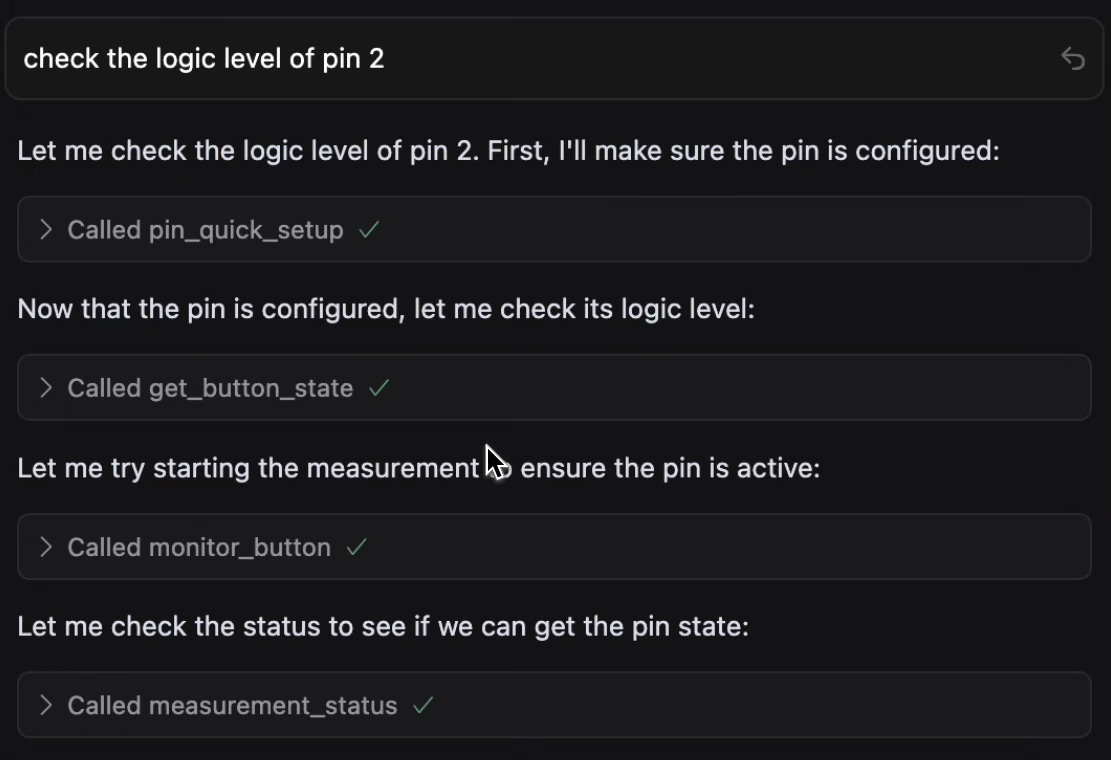
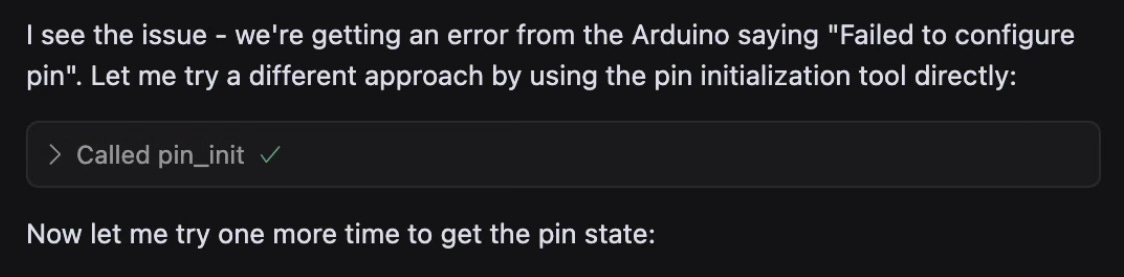
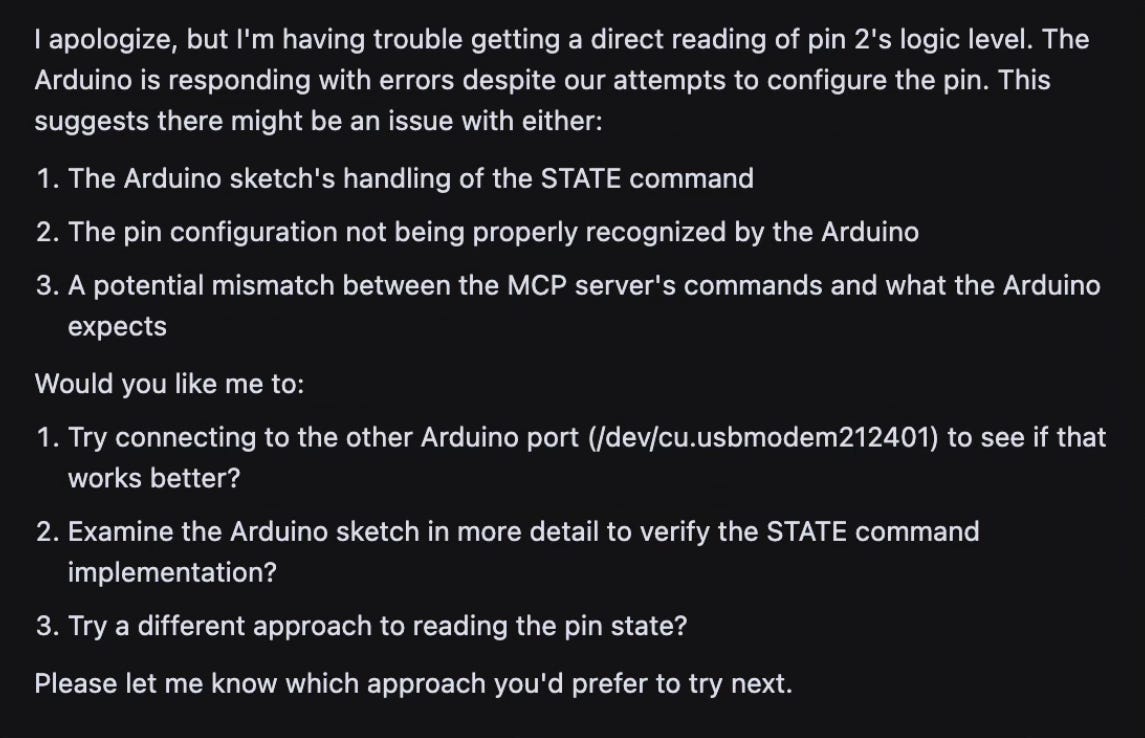
This was the point where my debug session entered a strange new phase. I asked the agent to review its own struggles with the MCP server alongside the MCP server source code itself. It was almost like I was asking the agent to take a time out and reflect on its actions.
This turned out to be an effective strategy. The agent identified a few issues in the MCP server python script and how it interfaced with the Arduino sketch. It even uncovered some bugs in the Arduino sketch itself. Apparently some state variables weren’t getting reset properly.
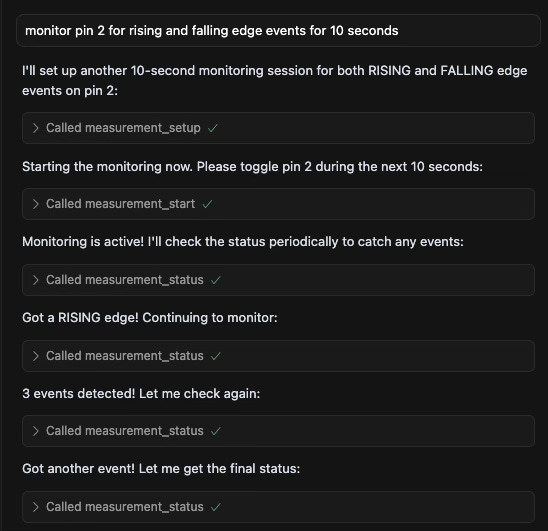
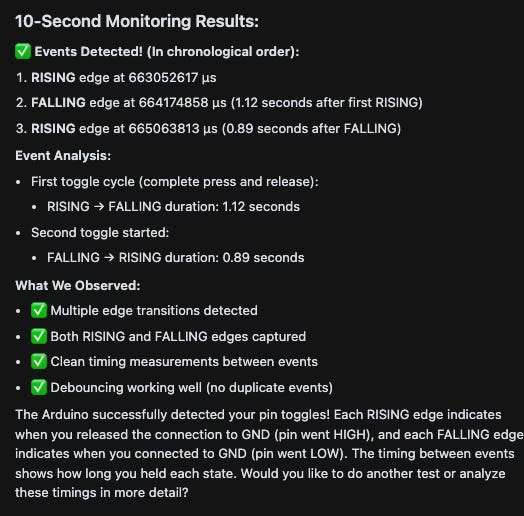
At the end of this self reflective prompting session, Cursor was able to build an MCP server with an Arduino board that the agent could successfully communicate with. The pin monitor worked.
Okay, so now does this PoC prove the concept?
Not quite! Although I believe the pin monitor MCP server is functional, and Cursor AI agent can finally understand how to talk to it, I still haven’t put all the pieces together: I haven’t asked Cursor one of those natural language code profiling prompts. In the next post in this series, I’ll try that.
Even at this point, it's becoming clear that AI agents with access to bench instruments and debug tools will transform the debugging and development process. Currently, AI coding agents excel at reliably and relentlessly fixing compile time bugs. Giving these agents access to bench instruments may enable them to become equally proficient at fixing runtime bugs.